Blog
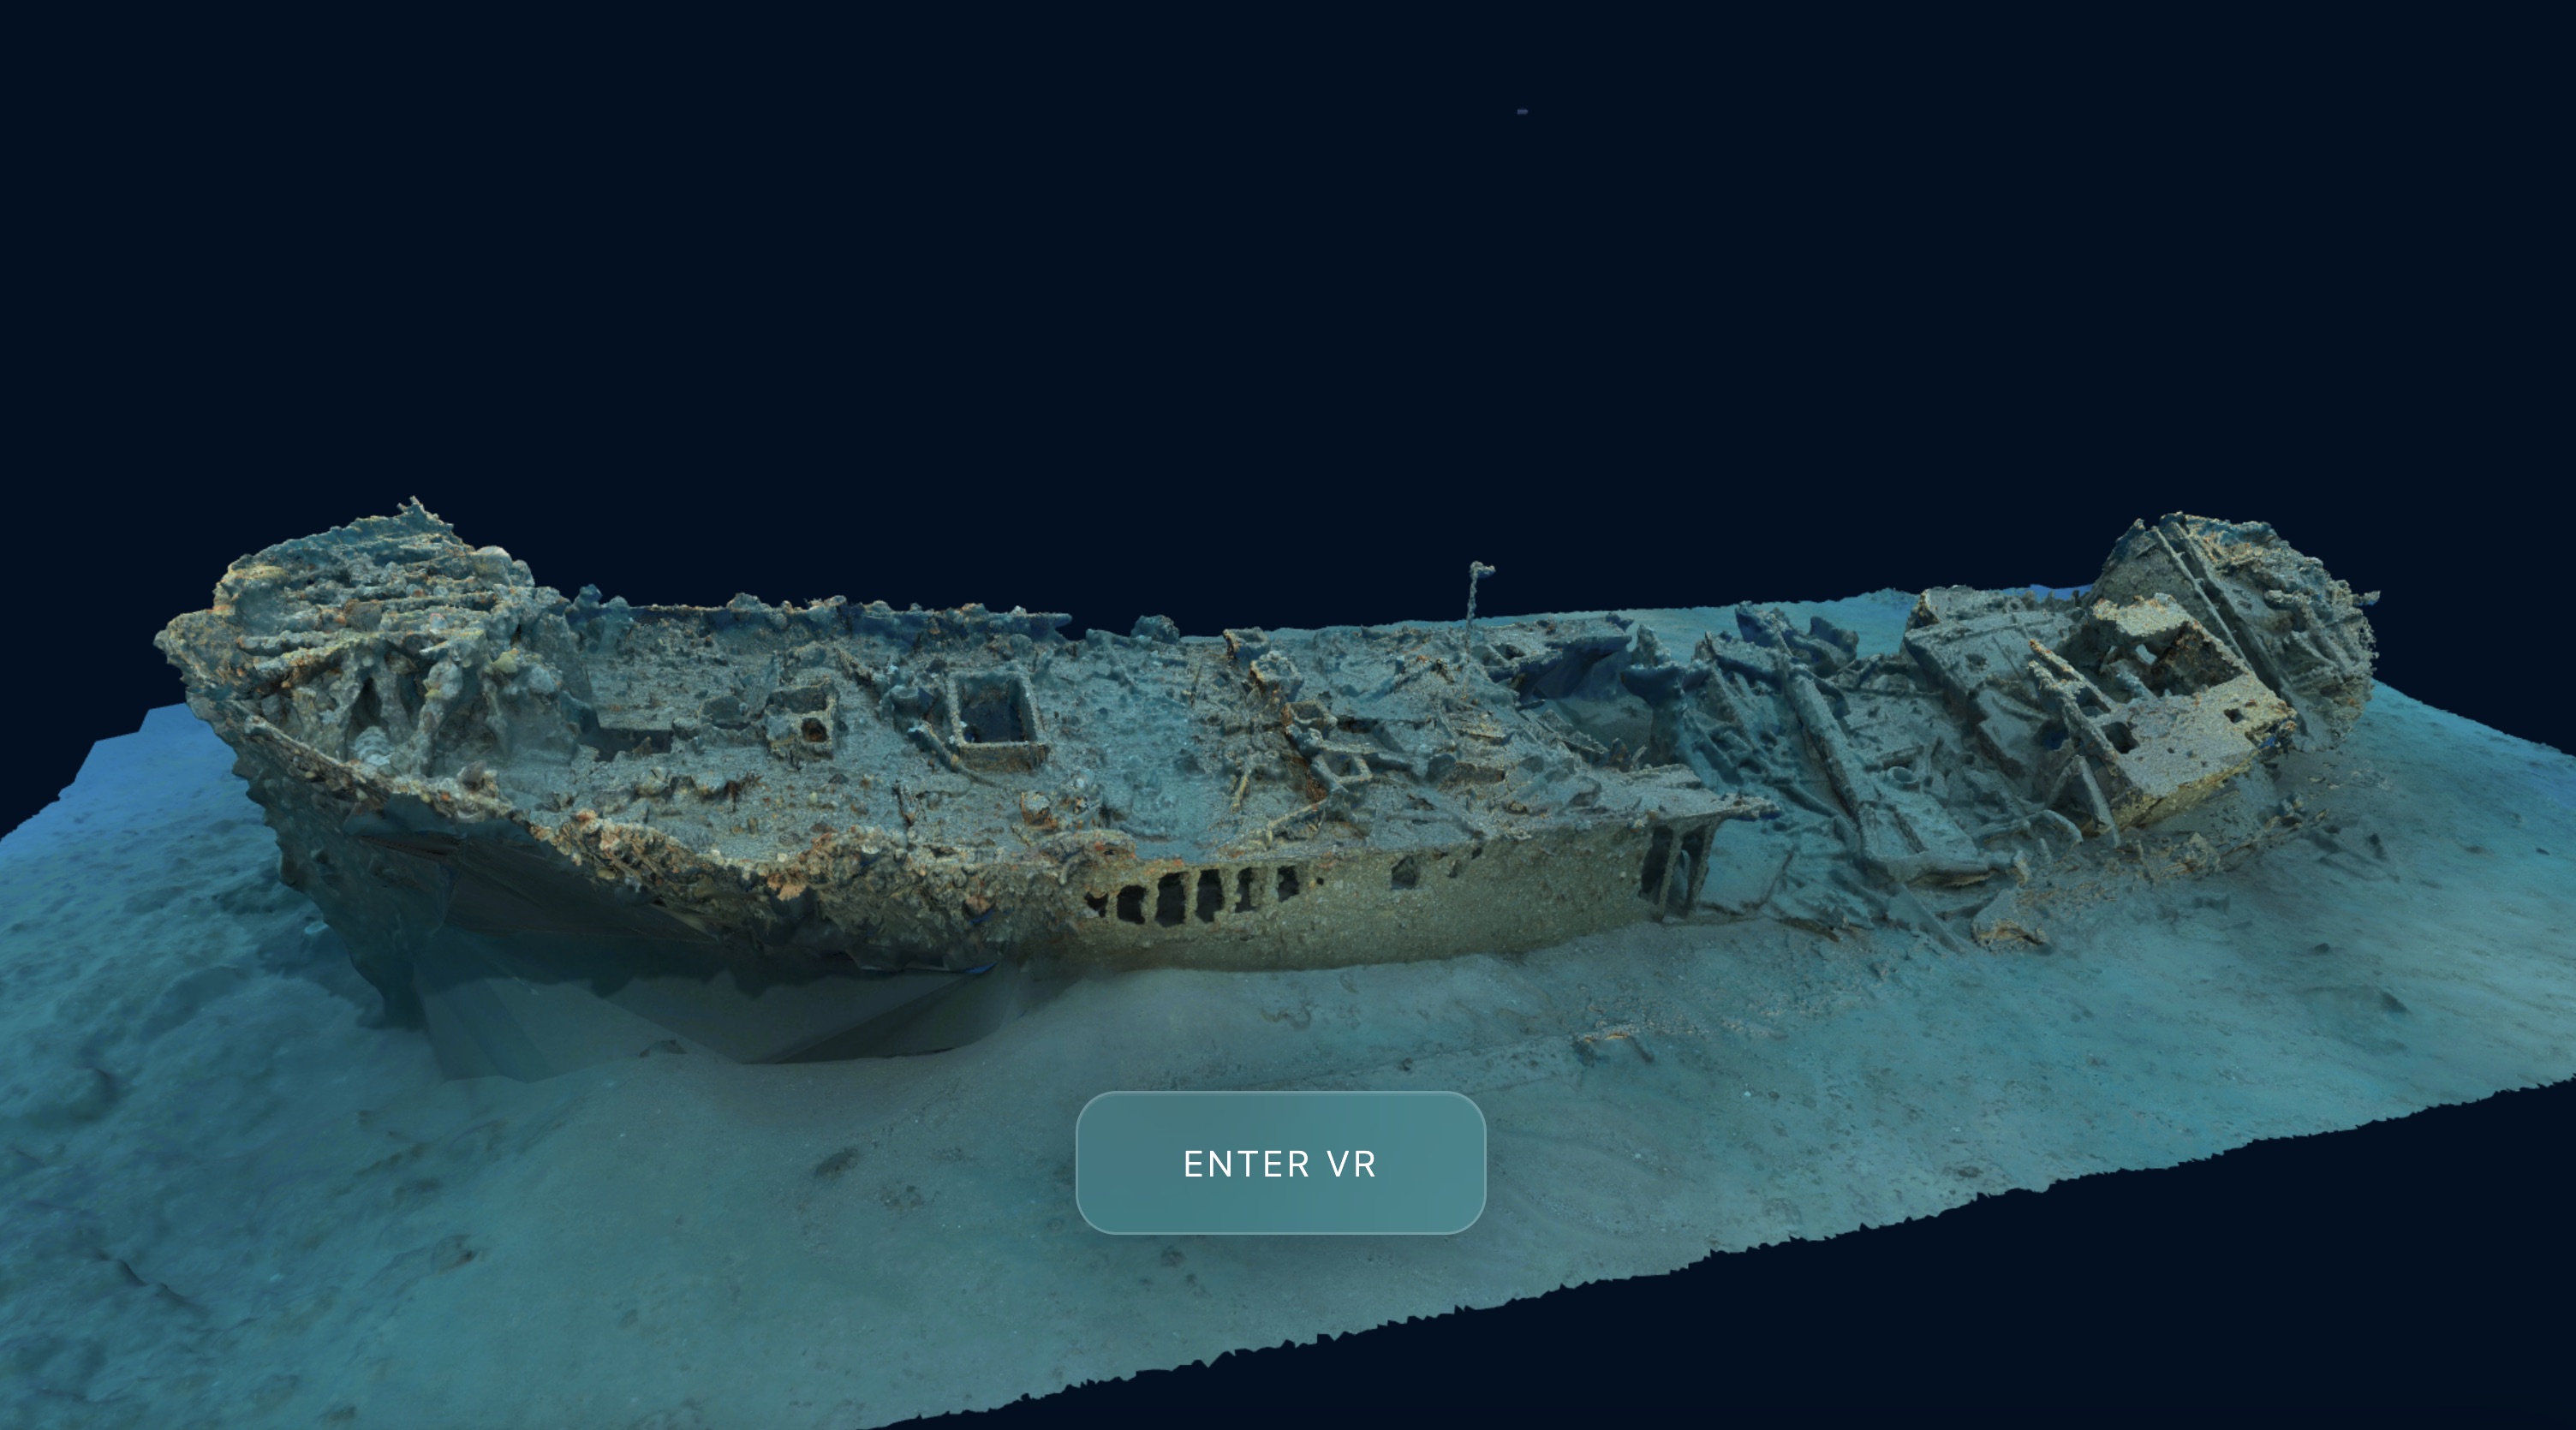
Moving your Shipwreck 3D Models from Sketchfab to BelowJS
My open-source software BelowJS is for displaying shipwreck models on your own terms, with strong VR support and measurement tools for archaeological research.
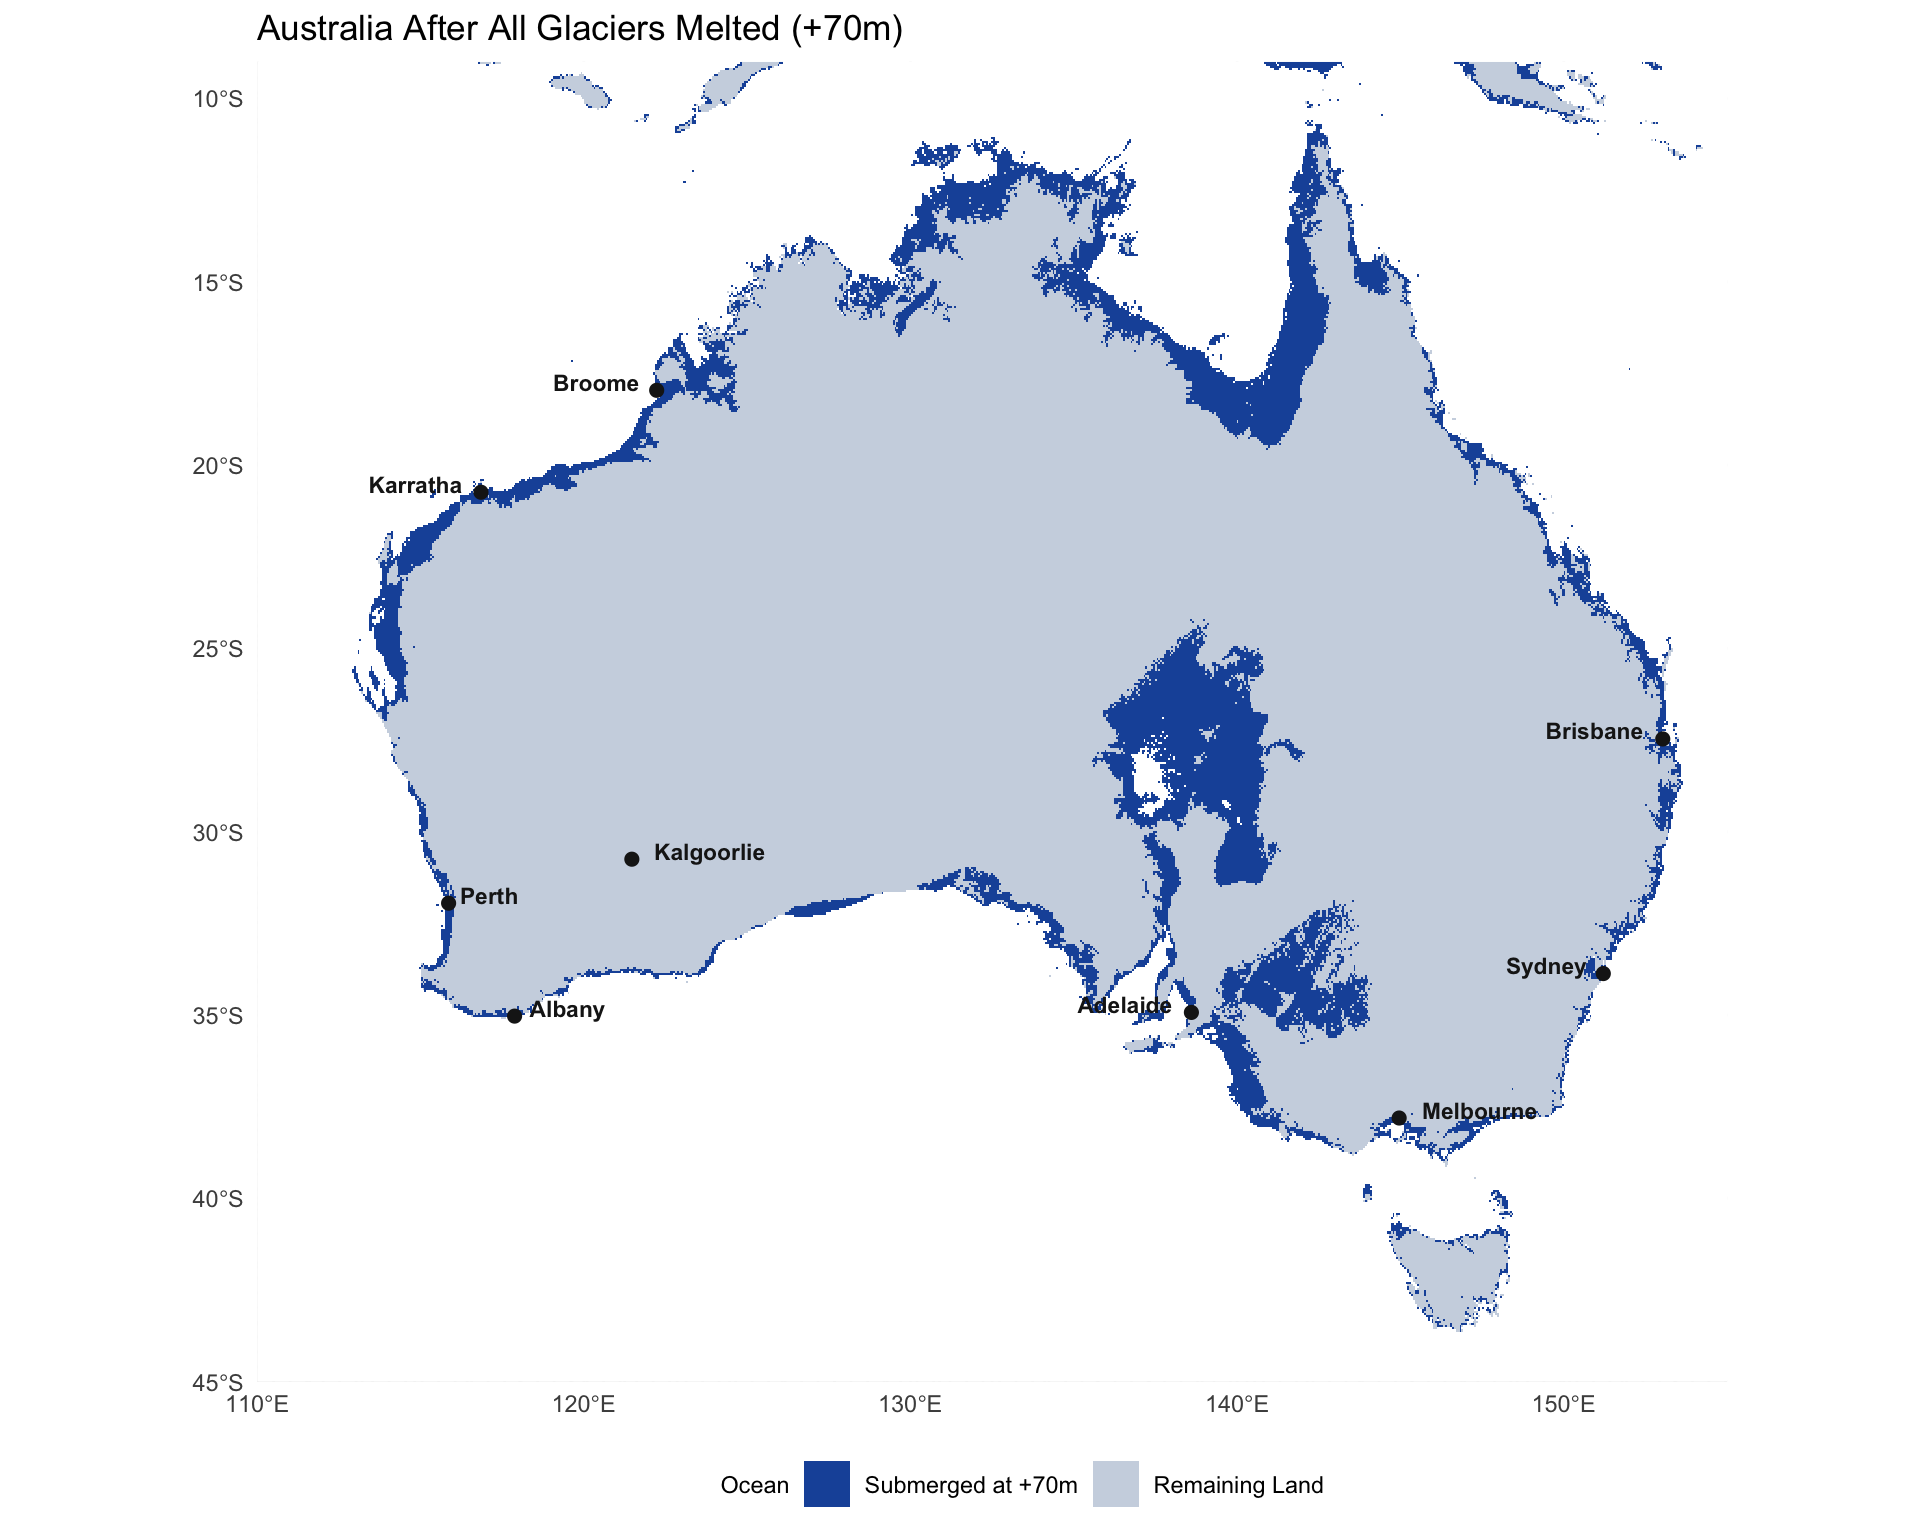
The archaeology of today, when the sea levels rise
What might 21st century Australia look like to future archaeologists? When the seas rise, they will have to look underwater.
Shipwreck Animations and Visualisations
A BelowJS browser-based tool for creating tasteful animations of 3D photogrammetry models.
Optimising Photogrammetry Models for WebXR and the Quest 3
BelowJS relies on well optimised .glbs to run 3D shipwreck models on mobile GPUs, this is how to use draco and KTX2 compression to comfortably display more than 1,000,000 polygons and 4x4k textures in VR.
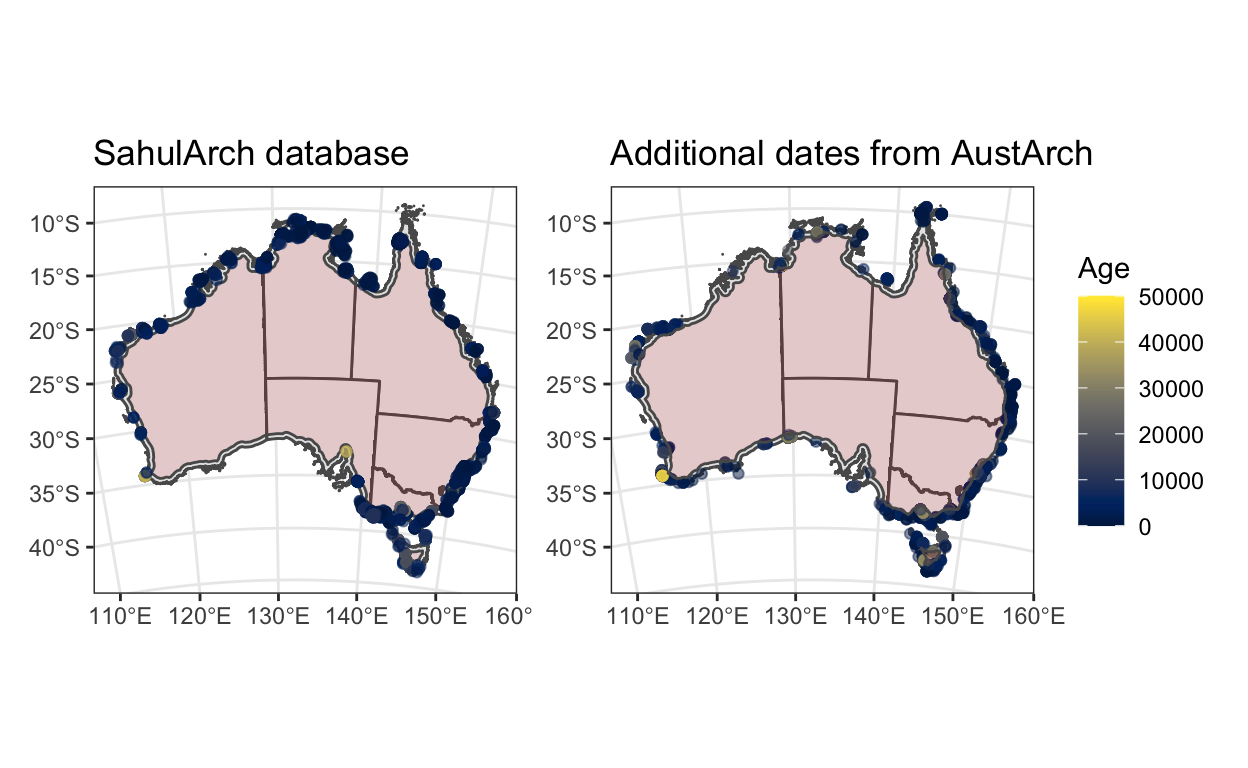
Archaeological dates for island occupation in Australia
Thousands of dates from archaeolgical sites around the continent reveal a complex and persistent pattern of island and coastal occupation, spanning 50,000 years.
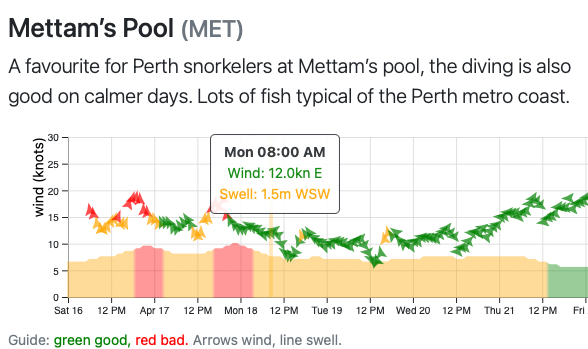
Visualising weather forecasts for diving and snorkelling
Divable conditions are mainly a factor of swell, wind and wind direction. With Python and d3, we can visualise the week ahead.
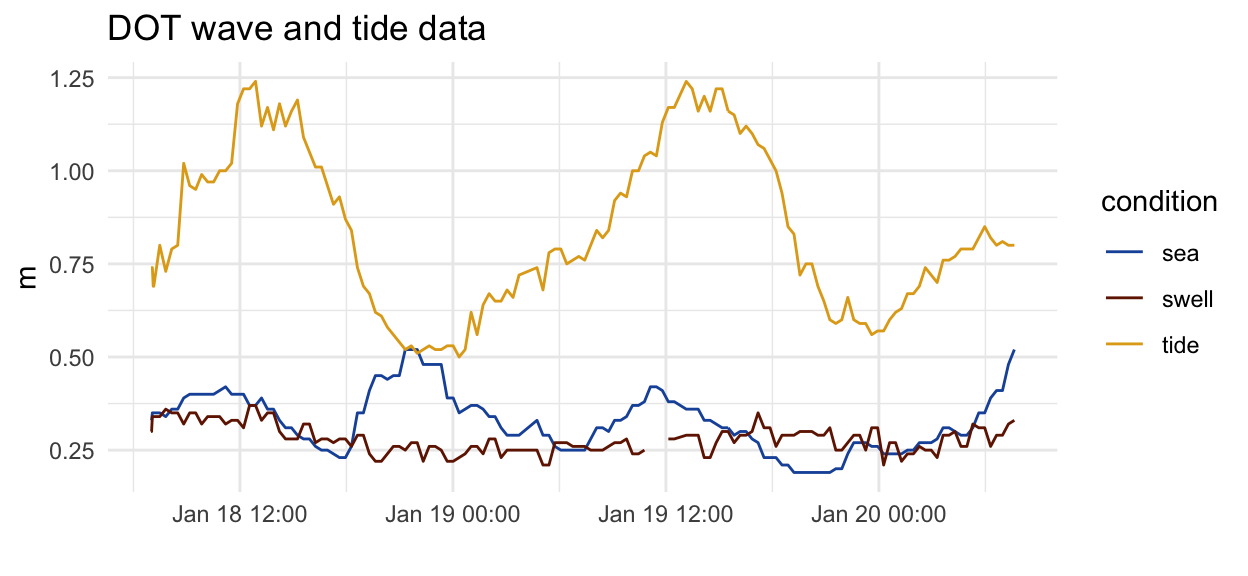
Getting live tide and swell data with tesseract and rvest
The Department of Transport publishes live tide and swell data, which can be scraped using just a few lines of R code.
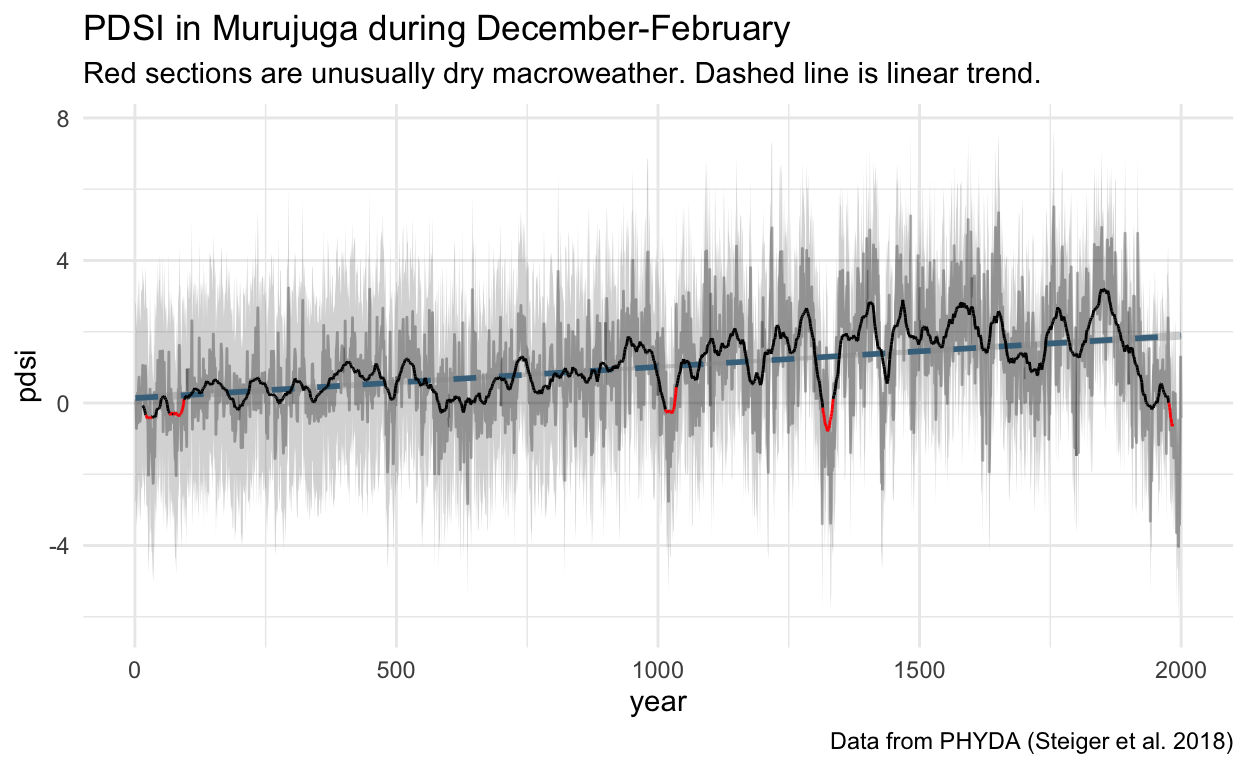
Murujuga's hydroclimate over the last 2000 years (draft)
Fresh water availability is an important constraint on human behaviour, and a major influence on culture. In northwest Australia, the major source is monsoonal rainfall. It is clear from the paleoclimate record that the monsoon has varied over deep time. In this post we'll use the PHYDA product to investigate this change over the last 2,000 years in Murujuga.
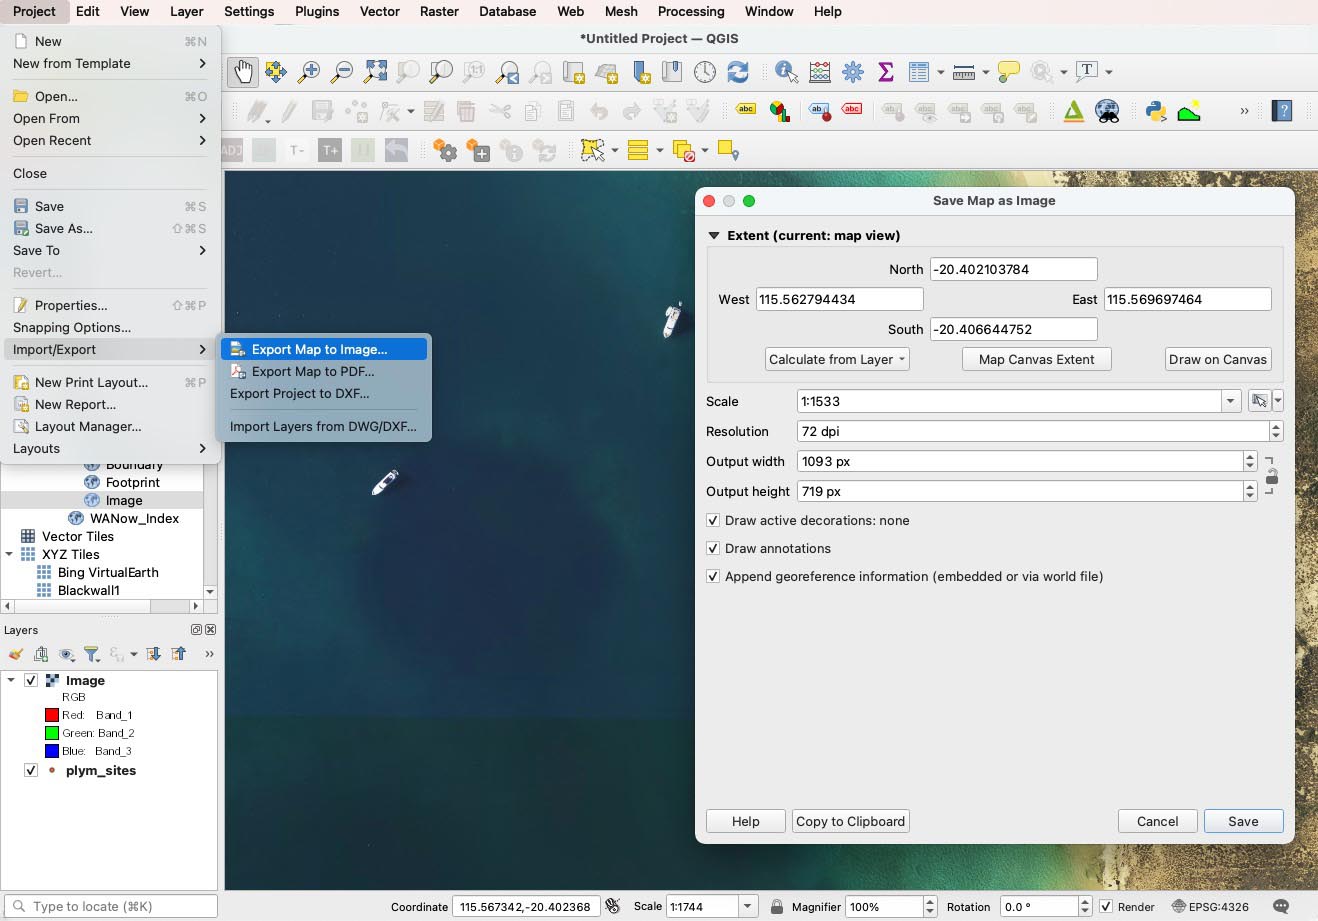
Using an iPhone as a GPS for archaeological fieldwork
Loading GPS points and georeferenced imagery onto a iPhone, using the GPS Tracks app and QGIS. This can be a convenient addition to any archaeolgist's toolkit.
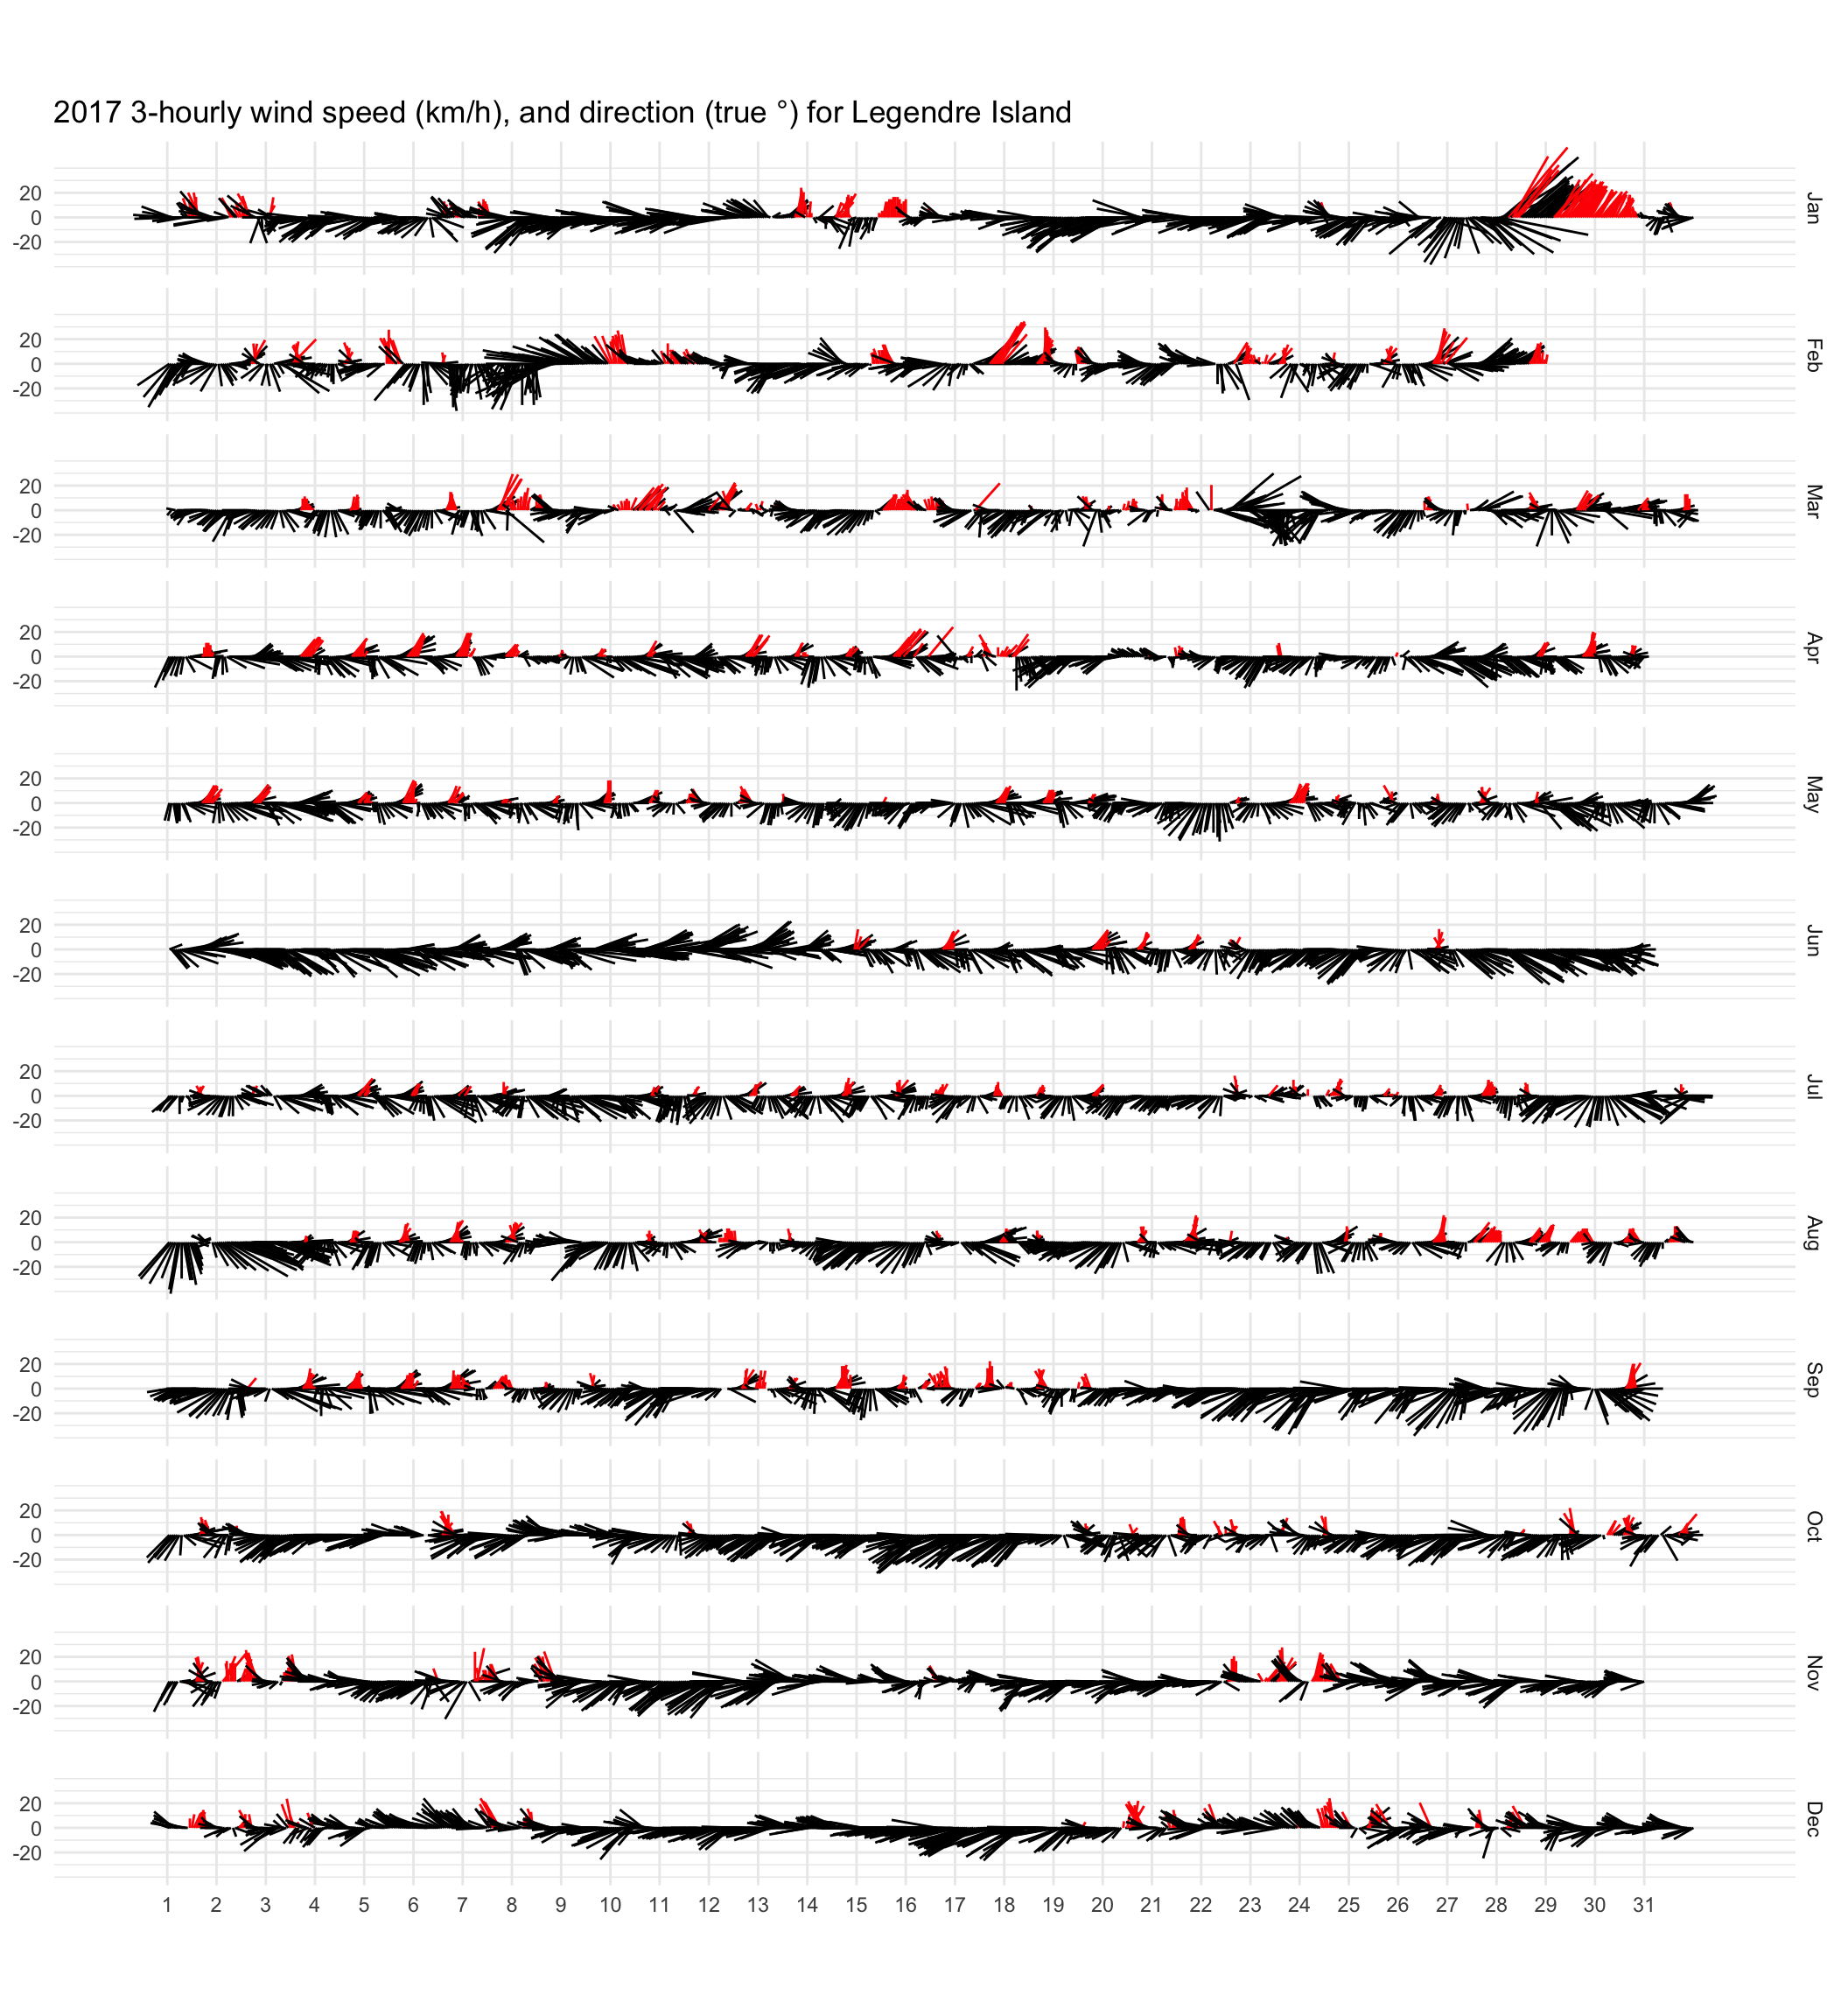
Wind time series plots in R
To understand how people voyaged accross the ocean in the past, we have to understand the climate they were living in, and how it was different to today. The first step is understanding the wind climate in the present.
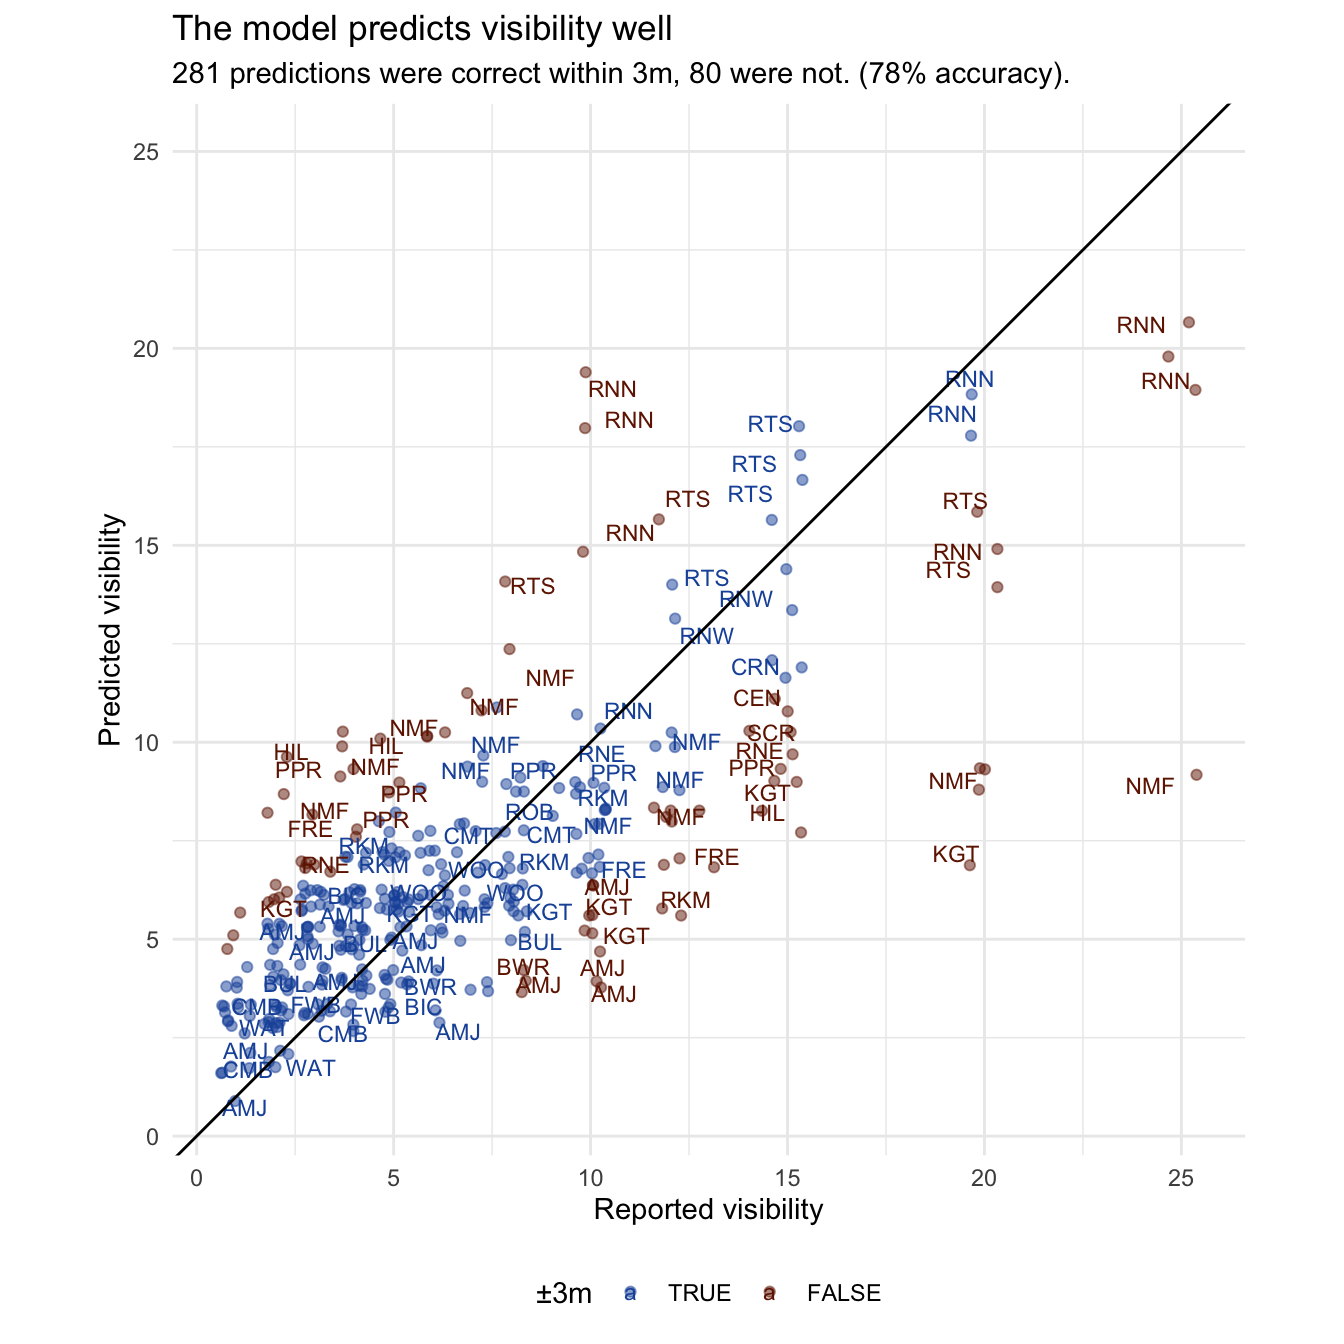
Predicting underwater visibility
Since Febrary 2020, Vis.Report has been helping divers share the conditions at local Perth dive sites. Now there is enough data to start predicting visibility based on site and weather.
Mapping Estimated Paleoshorelines in QGIS
Shorelines around the world have changed dramatically through time, often due to sea level rise. When working on archaeological sites from thousands of years ago, mapping these changes is important.
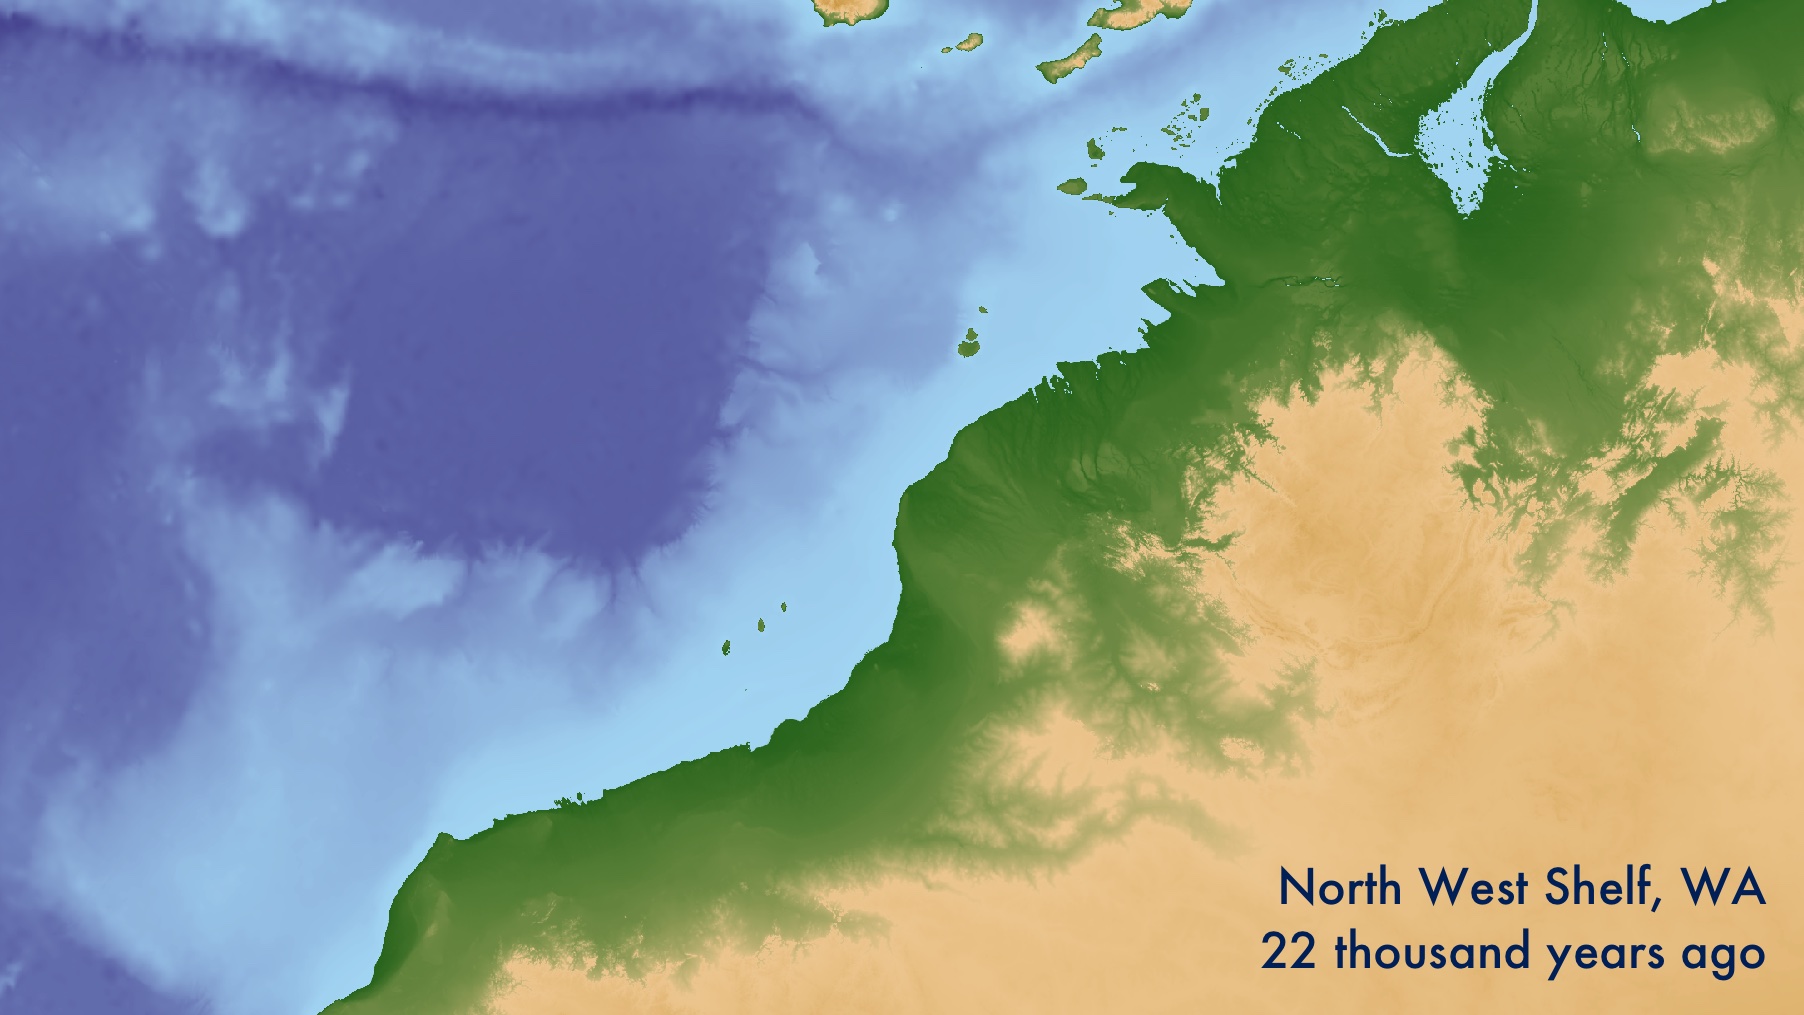
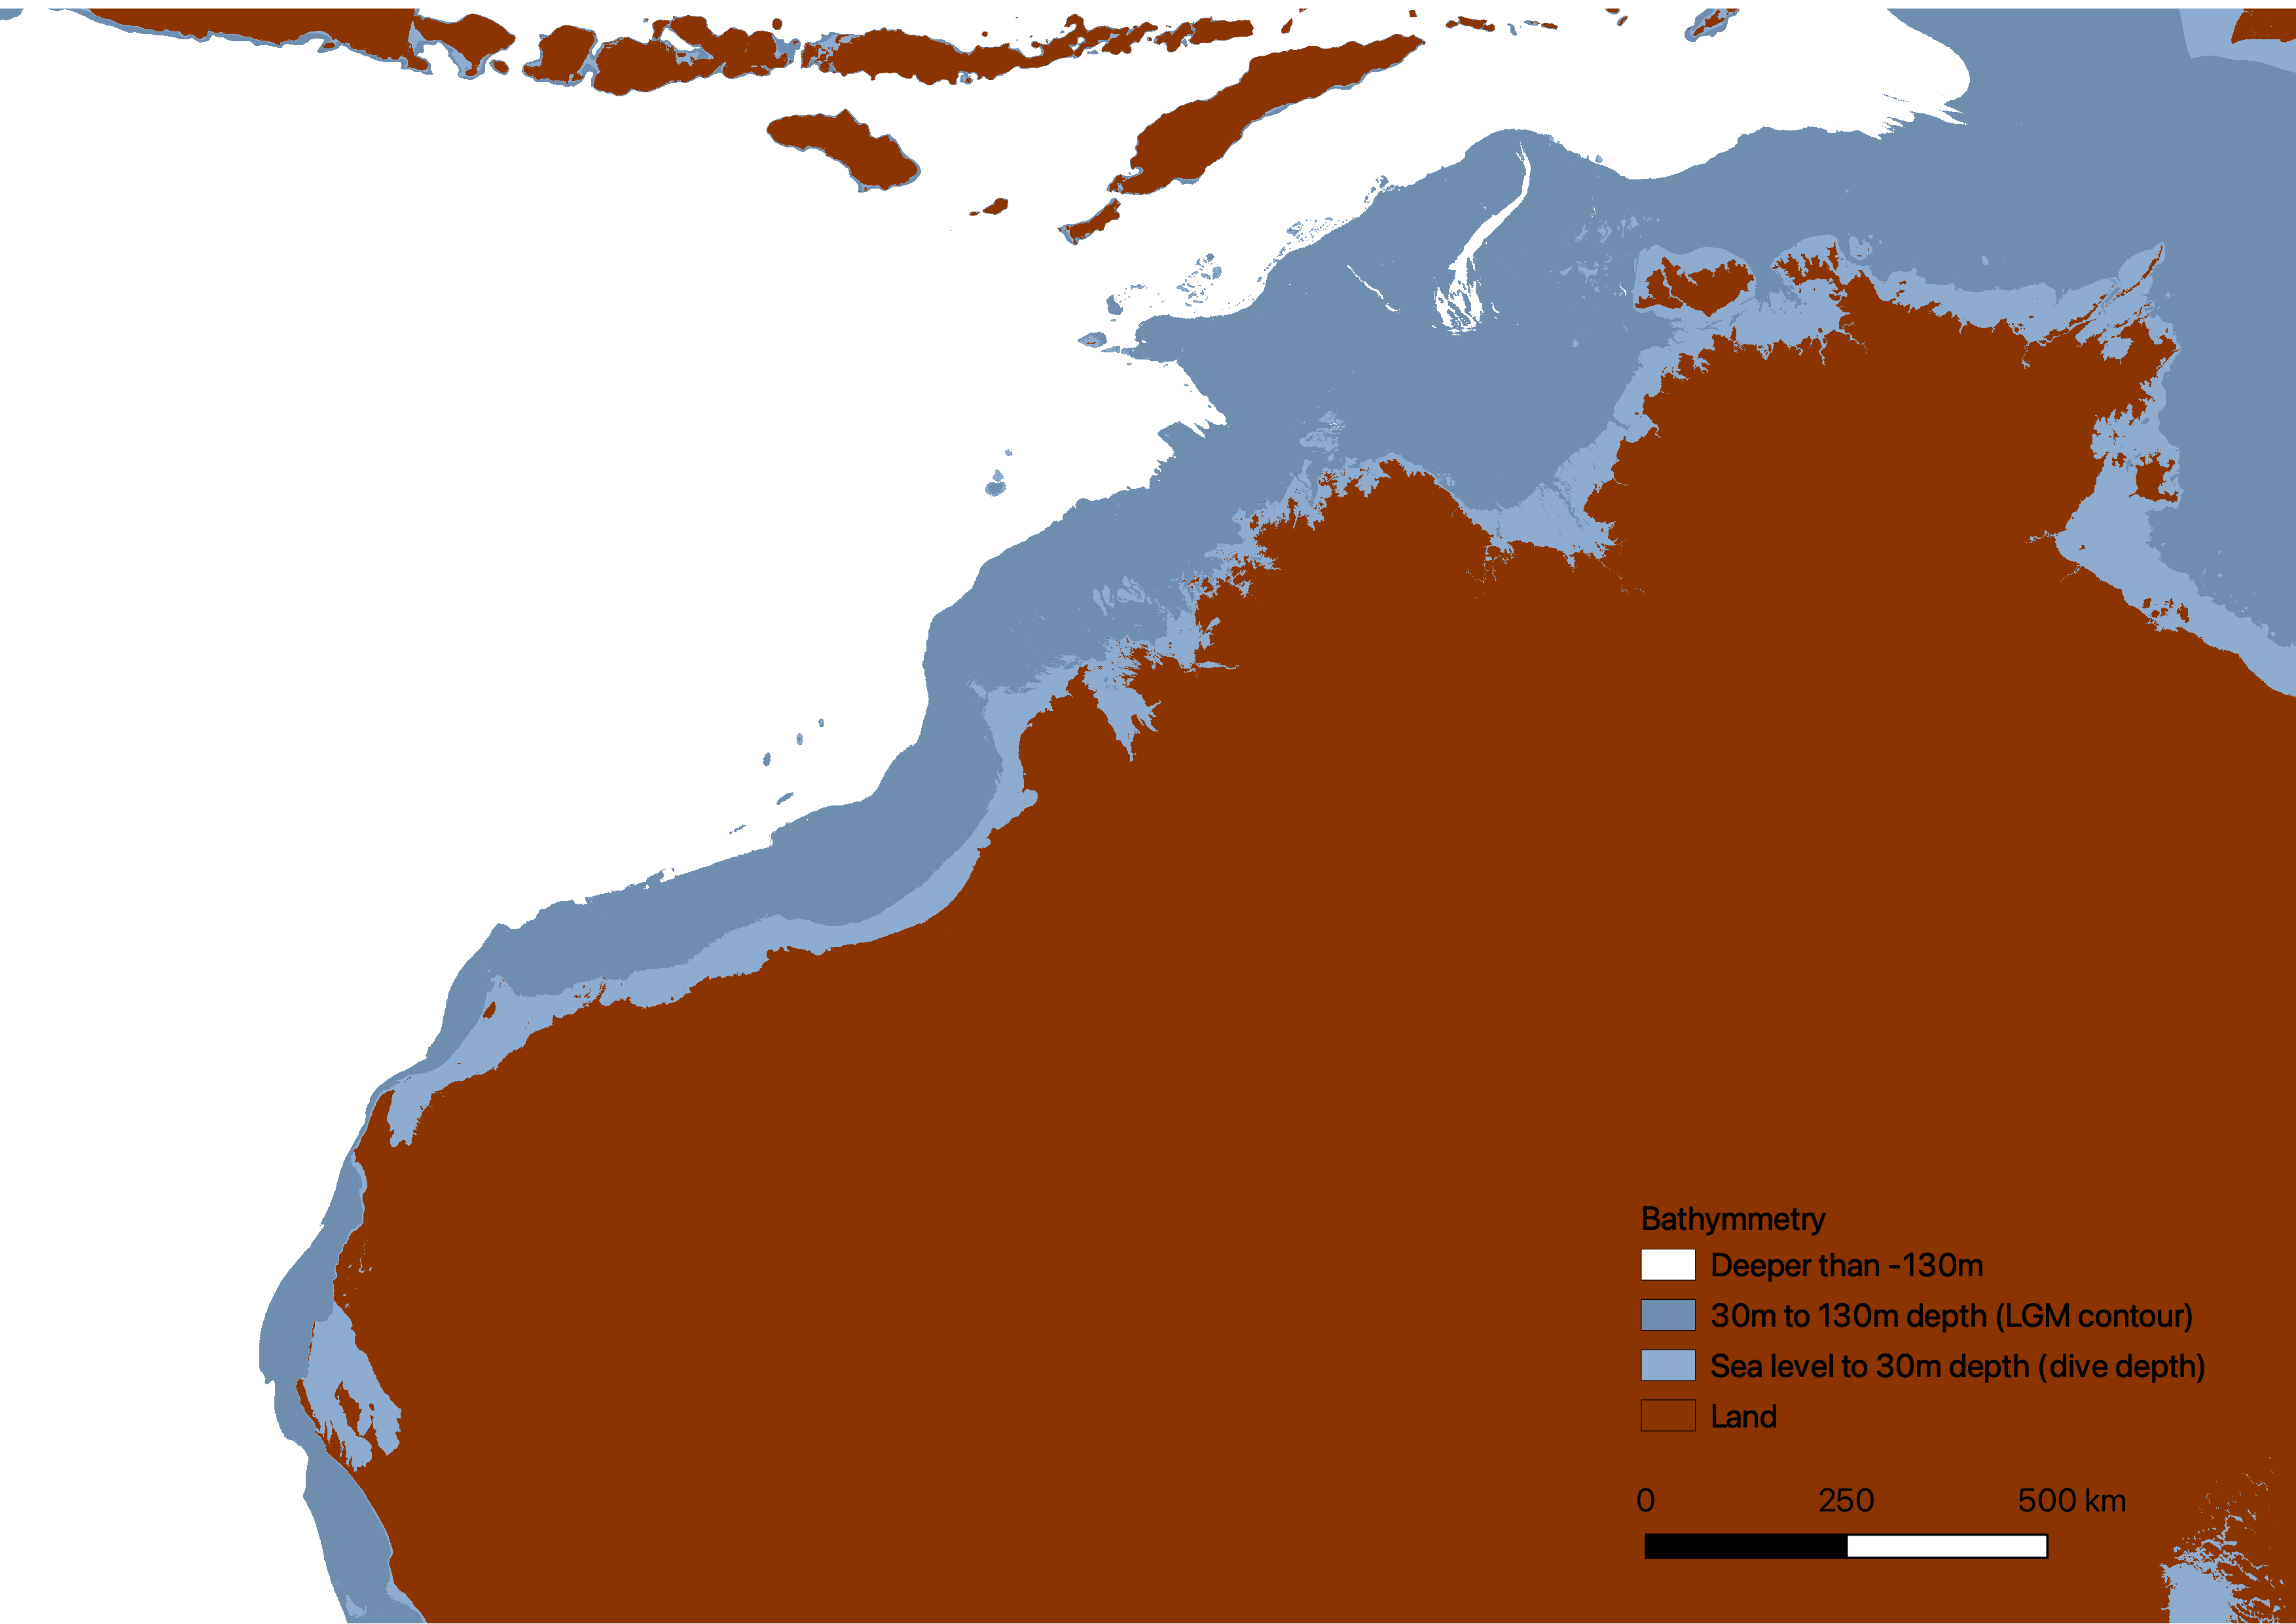
Submerged Landscapes Maps in R
Sea levels today are about 120m higher than they were 22 thousand years ago. Using R, we can estimate the extent of now-submerged lands people once walked on.