In the past 22,000 years, global sea levels have risen up to 130m (Grant et al. 2012). Using QGIS, we can make a first-order estimate of past shorelines and landscapes using sea level curves and modern bathymetry data1.
If you want to skip everything below, and just want to explore, here’s one I prepared earlier:2
The bathymetry data
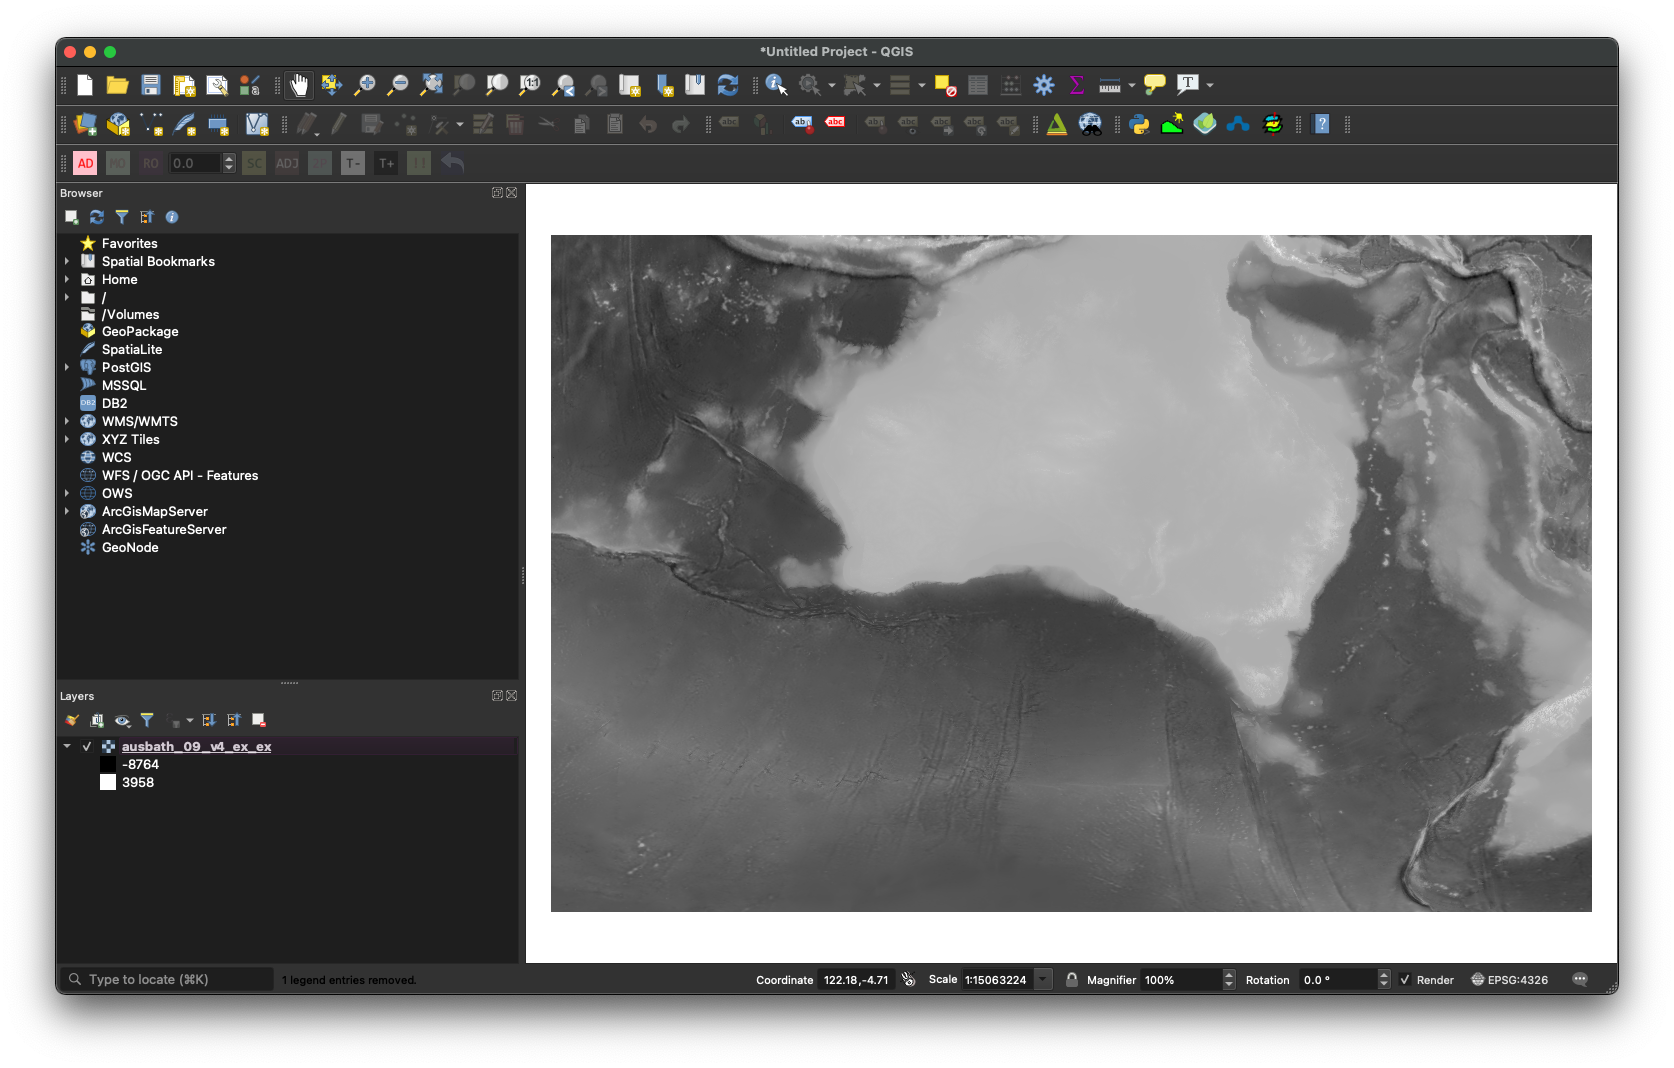
The Geoscience Australia Australian Bathymetry and Topography Grid (Whiteway, T. 2009) has elevation data for the entire Australian continent at a 250m horizontal resolution. It is available as a 1.3Gb *.ers grid file. Globally, a database like GEBCO is very useful.
Once you have the data downloaded, you can drag it (e.g. ausbath_09_v4_ex_ex.ers) into the QGIS main window. It should look like this:
Styling
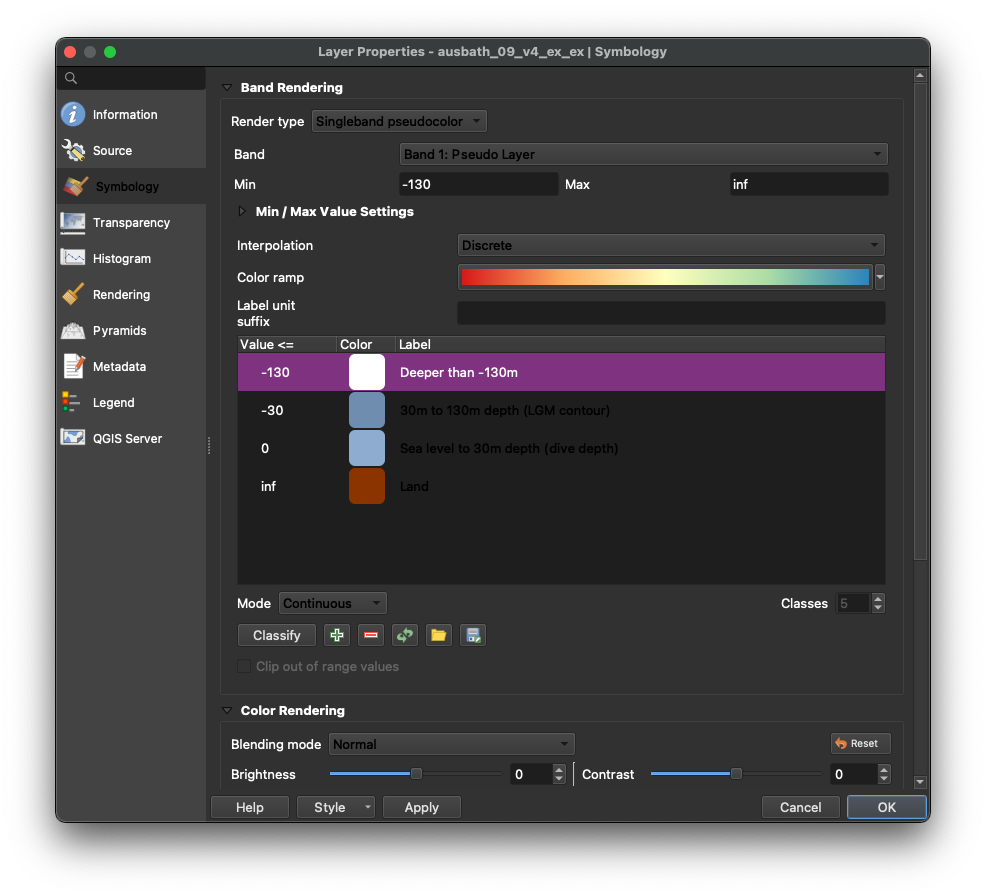
In the layers pane in the bottom left, right click on the layer, and select Properties. Using the Symbology tab, we will colour the layer by relevant contours. Change the render type to Singleband pseudocolour, the interpolation to Discrete, and then define custom colours3 based on your research question, like so:
| Value <= | Colour (HTML Notation) | Label |
|---|---|---|
| -130 | #FFFFFF | Deeper than -130m |
| -30 | #6E8DAF | 30m to 130m depth (LGM contour) |
| 0 | #8DACCF | Sea level to 30m depth (dive depth) |
| inf | #8B3400 | Land |
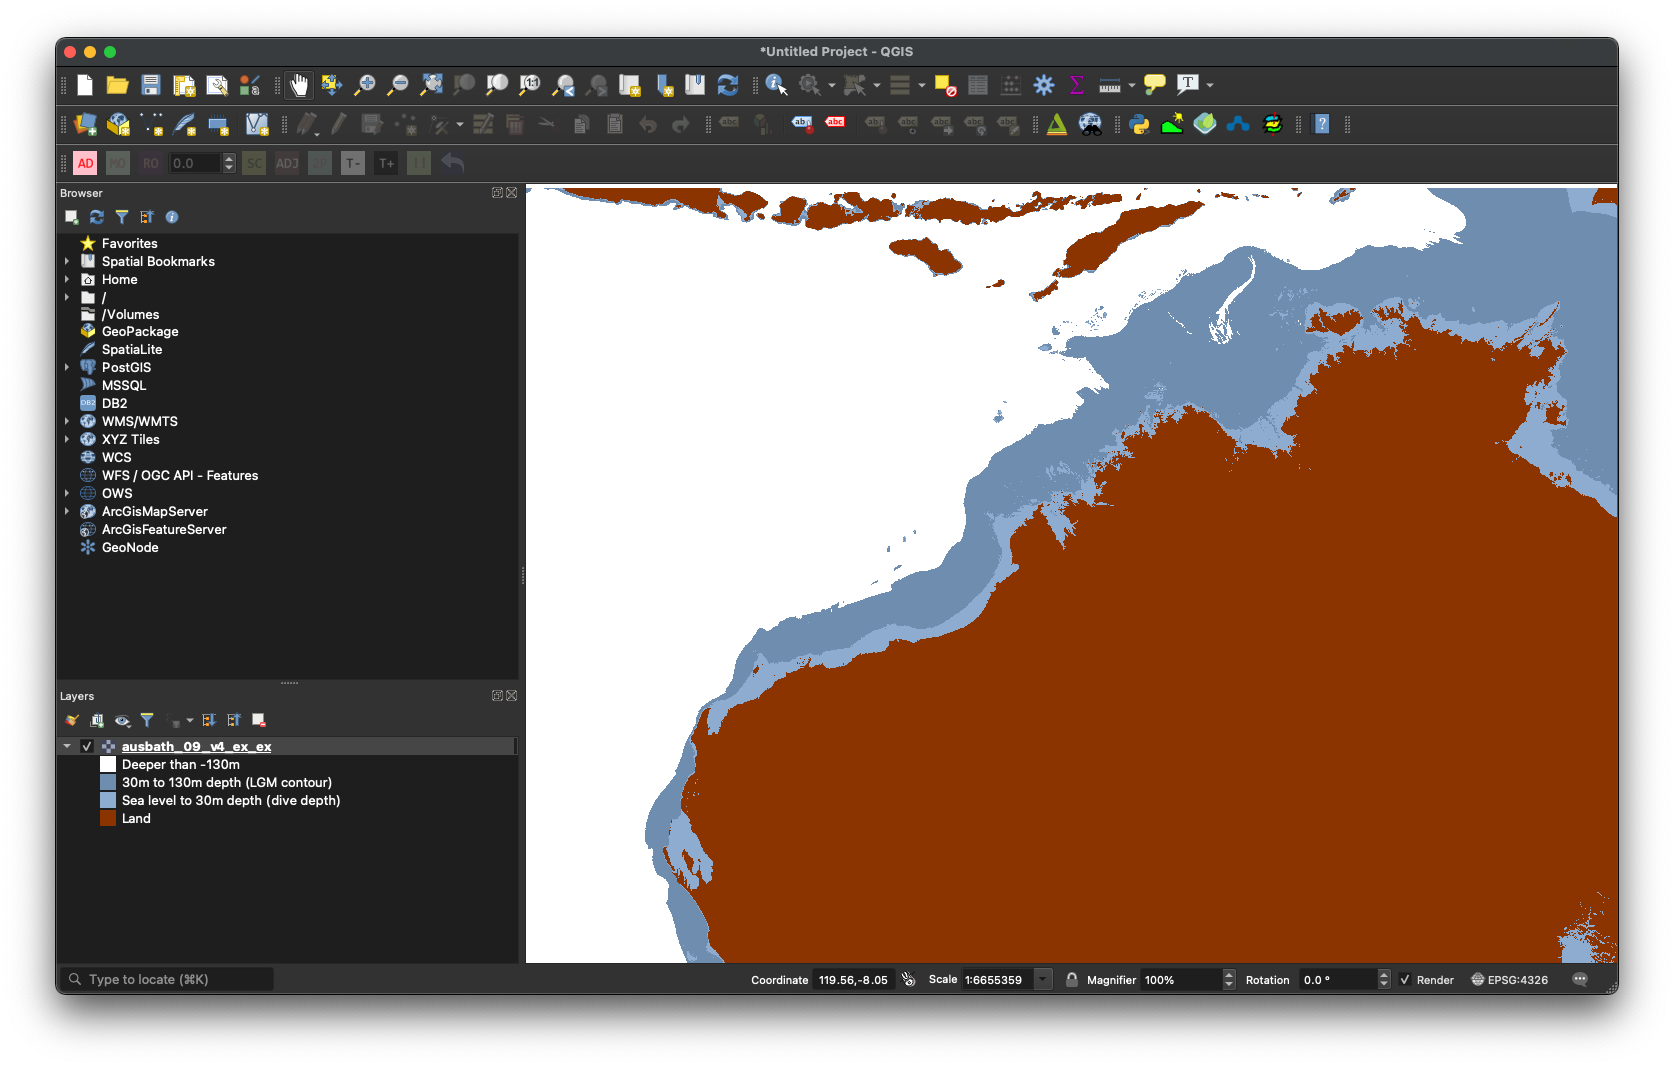
It should now look like this:
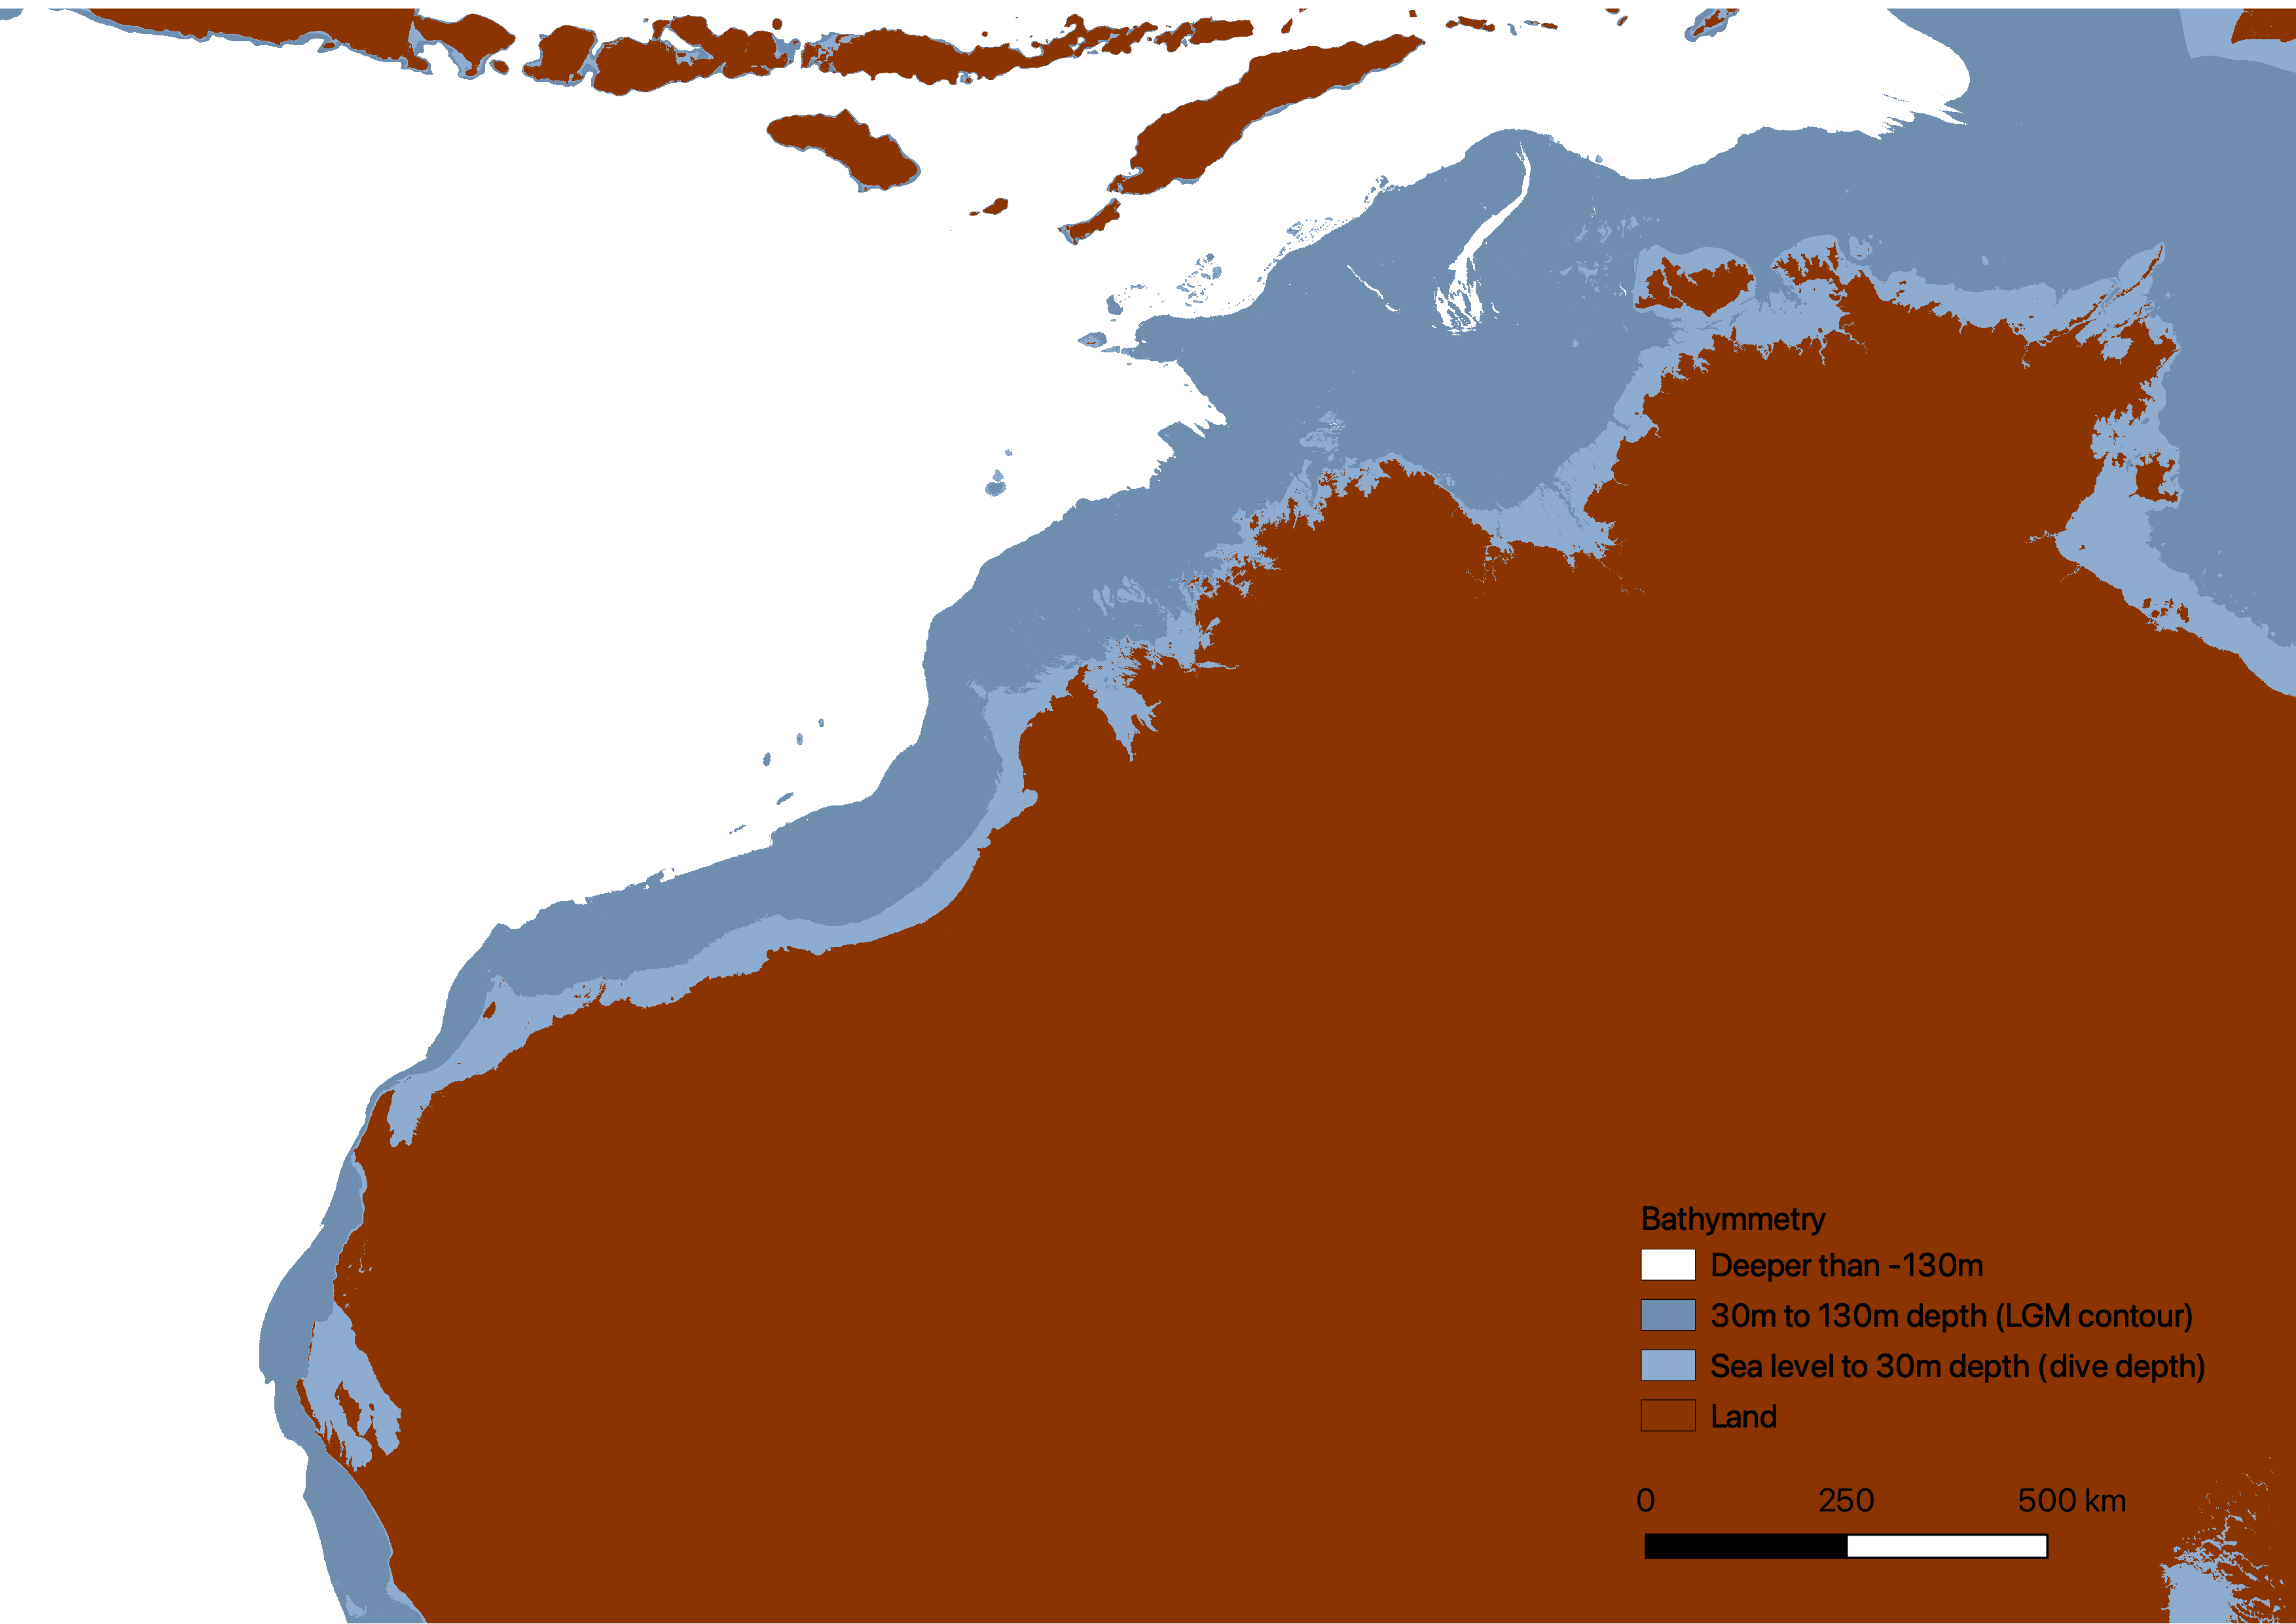
Final map
To finalise your map, create a new print layout (⌘P). Add a scale bar and a legend using the left hand pane. Don’t forget to reference the data, and note the limitations of your estimate!
Video version
For more detail, here is an extended version of the tutorial:
Be careful assuming modern bathymetry is a good proxy for past land surfaces. If you have access to estimates of past land surfaces derived from sub-bottom profiling, you should use this instead.↩︎
This is the whole GEBCO dataset processed as described in this post, then exported using GDAL2Tiles and hosted on Github pages. Full code is here: https://github.com/patrick-morrison/submerged_landscapes_world_map/↩︎
Alternatively, you can click Style (at the bottom), and load this: submerged_map.qml↩︎